Description:
This page demonstrates a map visualization using an array of png image files. There are 300 images stored in a local directory created using a Python script.
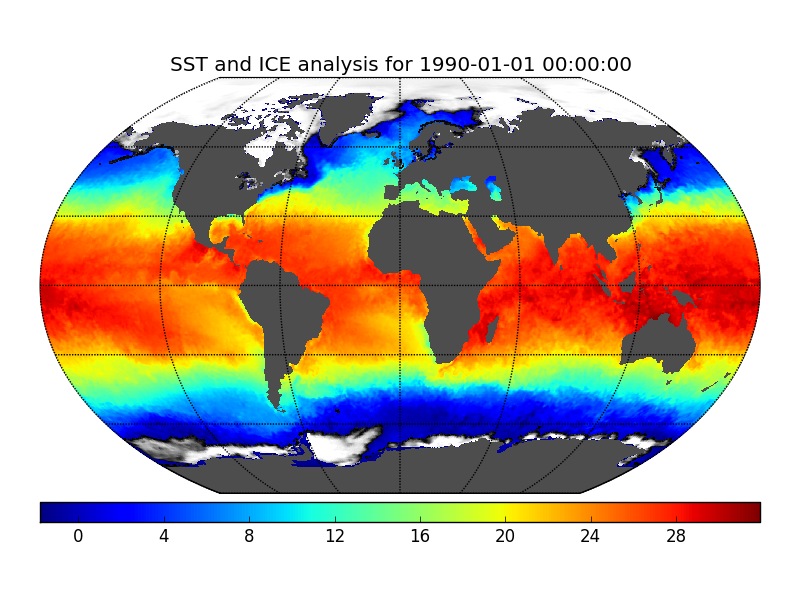
The images show the sea surface temperature (SST) and sea ice on the 1st day of each month from the start of 1990 through 2014. Temperatures are in degrees C.
Data Source:
The data is sourced from The National Oceanic and Atmospheric Administration
Code Description:
The Python code was sourced from http://matplotlib.org/basemap/users/index.html. I made minor modifications to the code to adapt it for the project. A copy of the code can be found locally here - python-map-ice.txt file.
The Python code was run on my local machine to create the images. The Python code requires several libraries to be present including numpy and matplotlib. PHP is used on the page to discover the images in the data directory and to pass an array of image names to the page script. The script then runs a continous loop, accessing the DOM ID of the current image and updating it to the next image in the array with a 500 ms delay.