Site Map
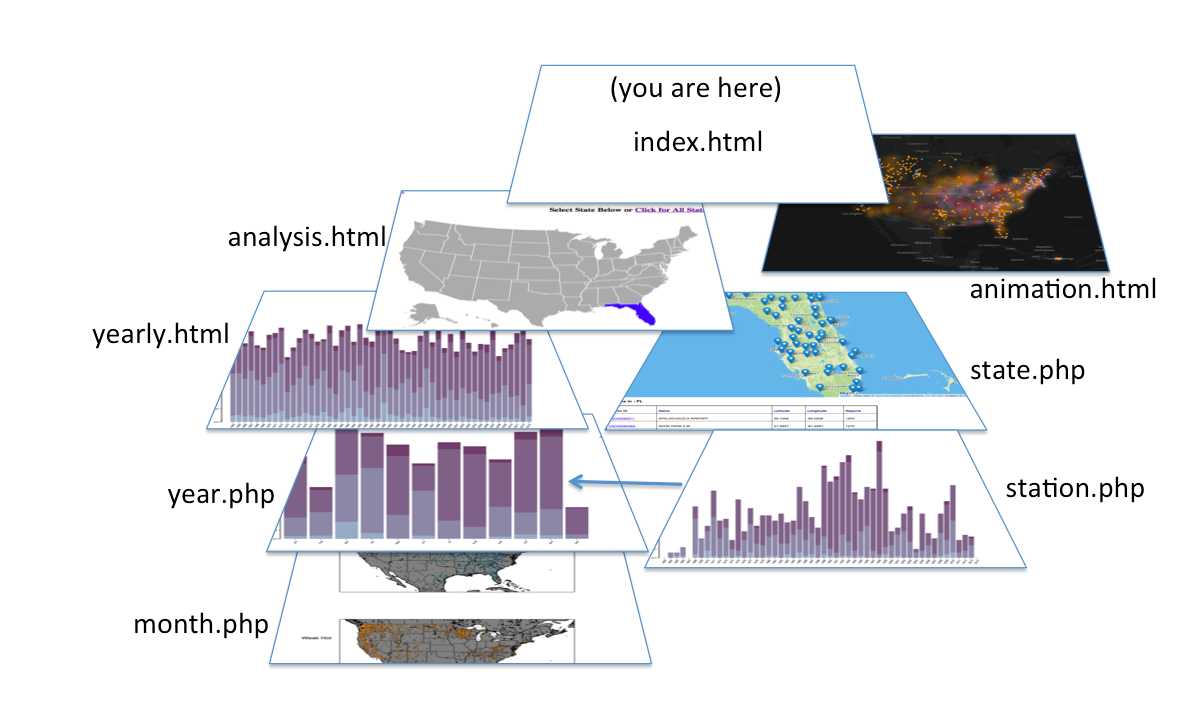
This project summarizes approx. 3M lines of data that was downloaded from an enigma labs project. The data categorizes temerpature data over 50 years from approx. 2800 US weather stations. The data is characterized into 4 different types.
Strong Cold: Both the daily high and low fell below the expected range.
Weak Cold: The daily high or low fell below the expected range.
Weak Hot: The daily high or low was above the expected range.
Strong Hot: Both the daily high and low was above the expected range.
Several tools were used to create this project. Initally the 3M rows of data was imported to IrisCouch to do some map-reduce manipulation. from there Python was used to create various JSON and CSV files as data sources for the website. Python was also used to create some map visuals. The website uses D3 libraries to create charts and interactive maps.